Methodology & Validation
How the groundwater estimate is produced, how to check its reliability for your own area, and — just as importantly — what it cannot do.
Last updated: August 2026
How the assessment works
The estimate combines a proprietary hydrogeological model with multiple public environmental datasets — digital terrain models, satellite-derived information, hydrographic networks and geological data. Rather than relying on a single parameter, the model brings several environmental indicators together to estimate groundwater depth and to evaluate how likely a location is to yield a productive well.
Artificial intelligence is used only in the final stage — not to "guess" groundwater, but to interpret the model's outputs, incorporate any optional information you provide, summarise relevant publicly available information about the local area, and generate a structured report in plain language. In other words: the scientific assessment comes first; the AI helps explain the results.
The depth-to-groundwater estimate is free and unlimited. Unlocking a location adds the model's drilling-suitability and expected-yield assessment, plus the detailed report.
Data sources
Relief: produced using Copernicus WorldDEM-30 © DLR e.V. 2010-2014 and © Airbus Defence and Space GmbH 2014-2018 provided under COPERNICUS by the European Union and ESA; all rights reserved. Hydrography: HydroRIVERS / HydroLAKES (© WWF / HydroSHEDS). Lithology: GLiM (Hartmann & Moosdorf, 2012), CC BY 3.0. Climate: Köppen-Geiger (Beck et al., 2018).
Location categories
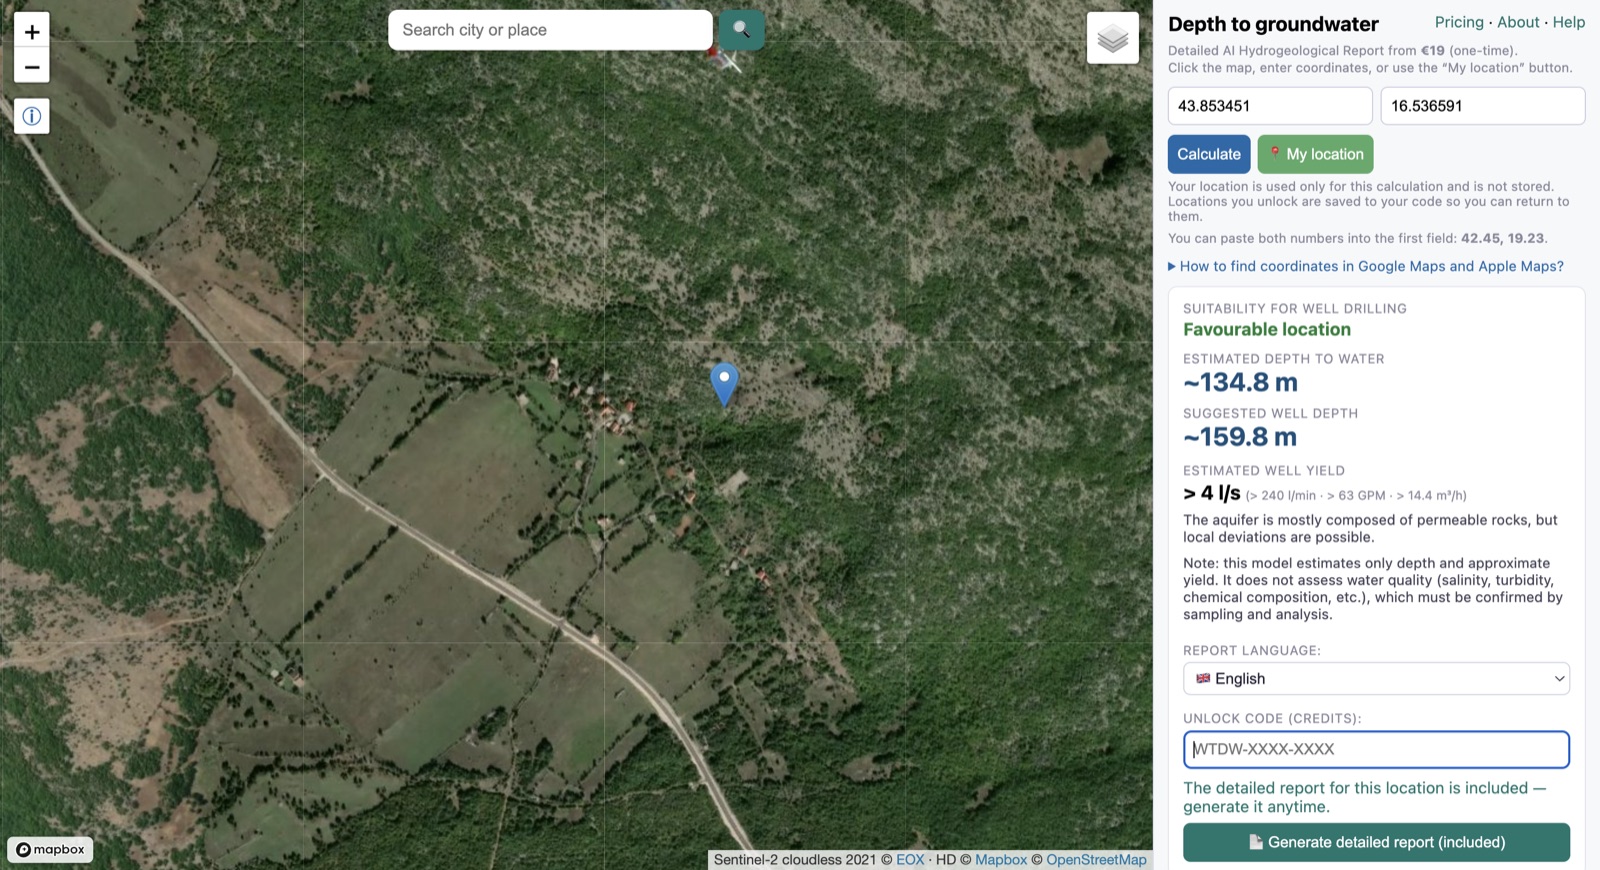
When a location is unlocked, its result falls into one of the categories below. This legend shows the drilling-suitability rating, the broadly expected well yield, and what each category means.
| Suitability for well drilling | Estimated well yield | What it means |
|---|---|---|
| Favourable | > 4 l/s (> 240 l/min · > 63 GPM · > 14.4 m³/h) | The aquifer is mostly composed of permeable rocks or sediments, but local deviations are possible. |
| Possibly favourable (uncertain) | > 4 l/s in karstified rock; < 0.2 l/s (< 12 l/min · < 3.2 GPM · < 0.7 m³/h) in claystone / marl / schist | From topography alone, karst and low-permeability hills cannot be reliably distinguished for this location. Treat this as tentative — the site may in fact be low-potential; field/geological verification is recommended.1 |
| Moderately favourable | > 4 l/s in gravelly–sandy material; < 0.2 l/s in clayey material | Drilling is not recommended where the sediments beneath the topsoil are known to be excessively clayey — whether they are can be uncertain from surface data (uncertain).1 |
| Moderate to low potential | < 1 l/s (< 60 l/min · < 16 GPM · < 3.6 m³/h) | If claystones, marls or schists are present at the microlocation, drilling is not recommended. |
| Low potential | < 0.2 l/s (< 12 l/min · < 3.2 GPM · < 0.7 m³/h) | If claystones, marls or schists are present at the microlocation, drilling is not recommended. |
1 Where marked, the AI analysis can help resolve the uncertainty by evaluating a
site photo and short description you provide, together with publicly available local information.
Depth: for any category, when the suggested drilling depth exceeds ~200 m (and further ~300 m),
an additional risk warning is shown — even a favourable location can be uneconomic, or technically very
hard for local drillers, at such depths.
Can you trust digital models?
This is probably the most important question, and the honest answer is: sometimes they perform remarkably well, and sometimes they do not. Hydrogeological conditions vary enormously around the world. In areas where measured groundwater levels and pumping-test results are available, comparisons show encouraging agreement with the estimates. In regions with highly complex geology, intense faulting or heterogeneous aquifers, deviations can occur. No responsible hydrogeologist should promise perfect accuracy — a digital assessment is best treated as an additional source of information that helps guide better decisions.
How to check reliability for your area
Before relying on the results for your own property, compare the model against several nearby locations whose groundwater depth or productivity is already known — for example:
- productive wells and dry wells nearby,
- neighbours' wells,
- municipal records,
- publicly available groundwater and drilling data.
If the estimates reasonably match local reality, confidence in the assessment increases. This simple verification step often provides far more insight than judging a model in isolation — and it is the best way to gauge accuracy for your area, where local geology may differ from regional data.
What the results can be used for
Beyond siting a water well, a preliminary estimate of the depth to the water table (and, once unlocked, drilling suitability and expected yield) is useful input for:
- Environmental impact assessment (EIA) — baseline depth-to-groundwater information when evaluating a project's effects on the environment and on groundwater resources;
- Civil engineering & mining — anticipating the dewatering (drainage) of excavations, foundations, tunnels and underground mine workings;
- Urban & spatial planning — screening land for development: a shallow water table in unconsolidated (loose) sediments can amplify seismic ground shaking and increase the risk of liquefaction;
- Ground-source heating & cooling — a first feasibility check for water-to-water (open-loop) heat-pump systems, which depend on accessible groundwater;
- Groundwater vulnerability & protection — a shallower water table generally means greater vulnerability to pollution from the surface, informing protection and land-use decisions;
- Water supply — siting wells for household, livestock and irrigation needs.
These are preliminary, screening-level indications; each application should be confirmed by the appropriate field investigation and a licensed professional.
What this tool can — and cannot — do
- Estimate groundwater depth;
- Assess drilling suitability;
- Estimate expected well productivity;
- Provide a structured hydrogeological assessment;
- Generate an AI-assisted report incorporating your observations and local public information;
- Help reduce uncertainty before investing in drilling.
- Guarantee groundwater will be found;
- Guarantee a productive well;
- Replace licensed hydrogeologists;
- Replace field investigations, drilling or pumping tests;
- Detect every local geological anomaly;
- Assess water quality (salinity, turbidity, chemical composition, etc.);
- Eliminate drilling risk.
Cite this method: Radulović, M. (2026). Preliminary Estimation of Groundwater Depth and Well Prospectivity from Open Global Datasets: A Technical Overview. Zenodo. https://doi.org/10.5281/zenodo.21667420
Estimates from wheretodigwell.com are a preliminary, data-based screening tool, not
a guarantee of groundwater conditions at any specific site. Actual depth, yield and water quality
can only be confirmed by drilling and testing, and local conditions may differ from regional data.
Always check local regulations before constructing a well.
Methodology development lead: Prof. Milan Radulović, PhD in Hydrogeology, Podgorica, Montenegro.