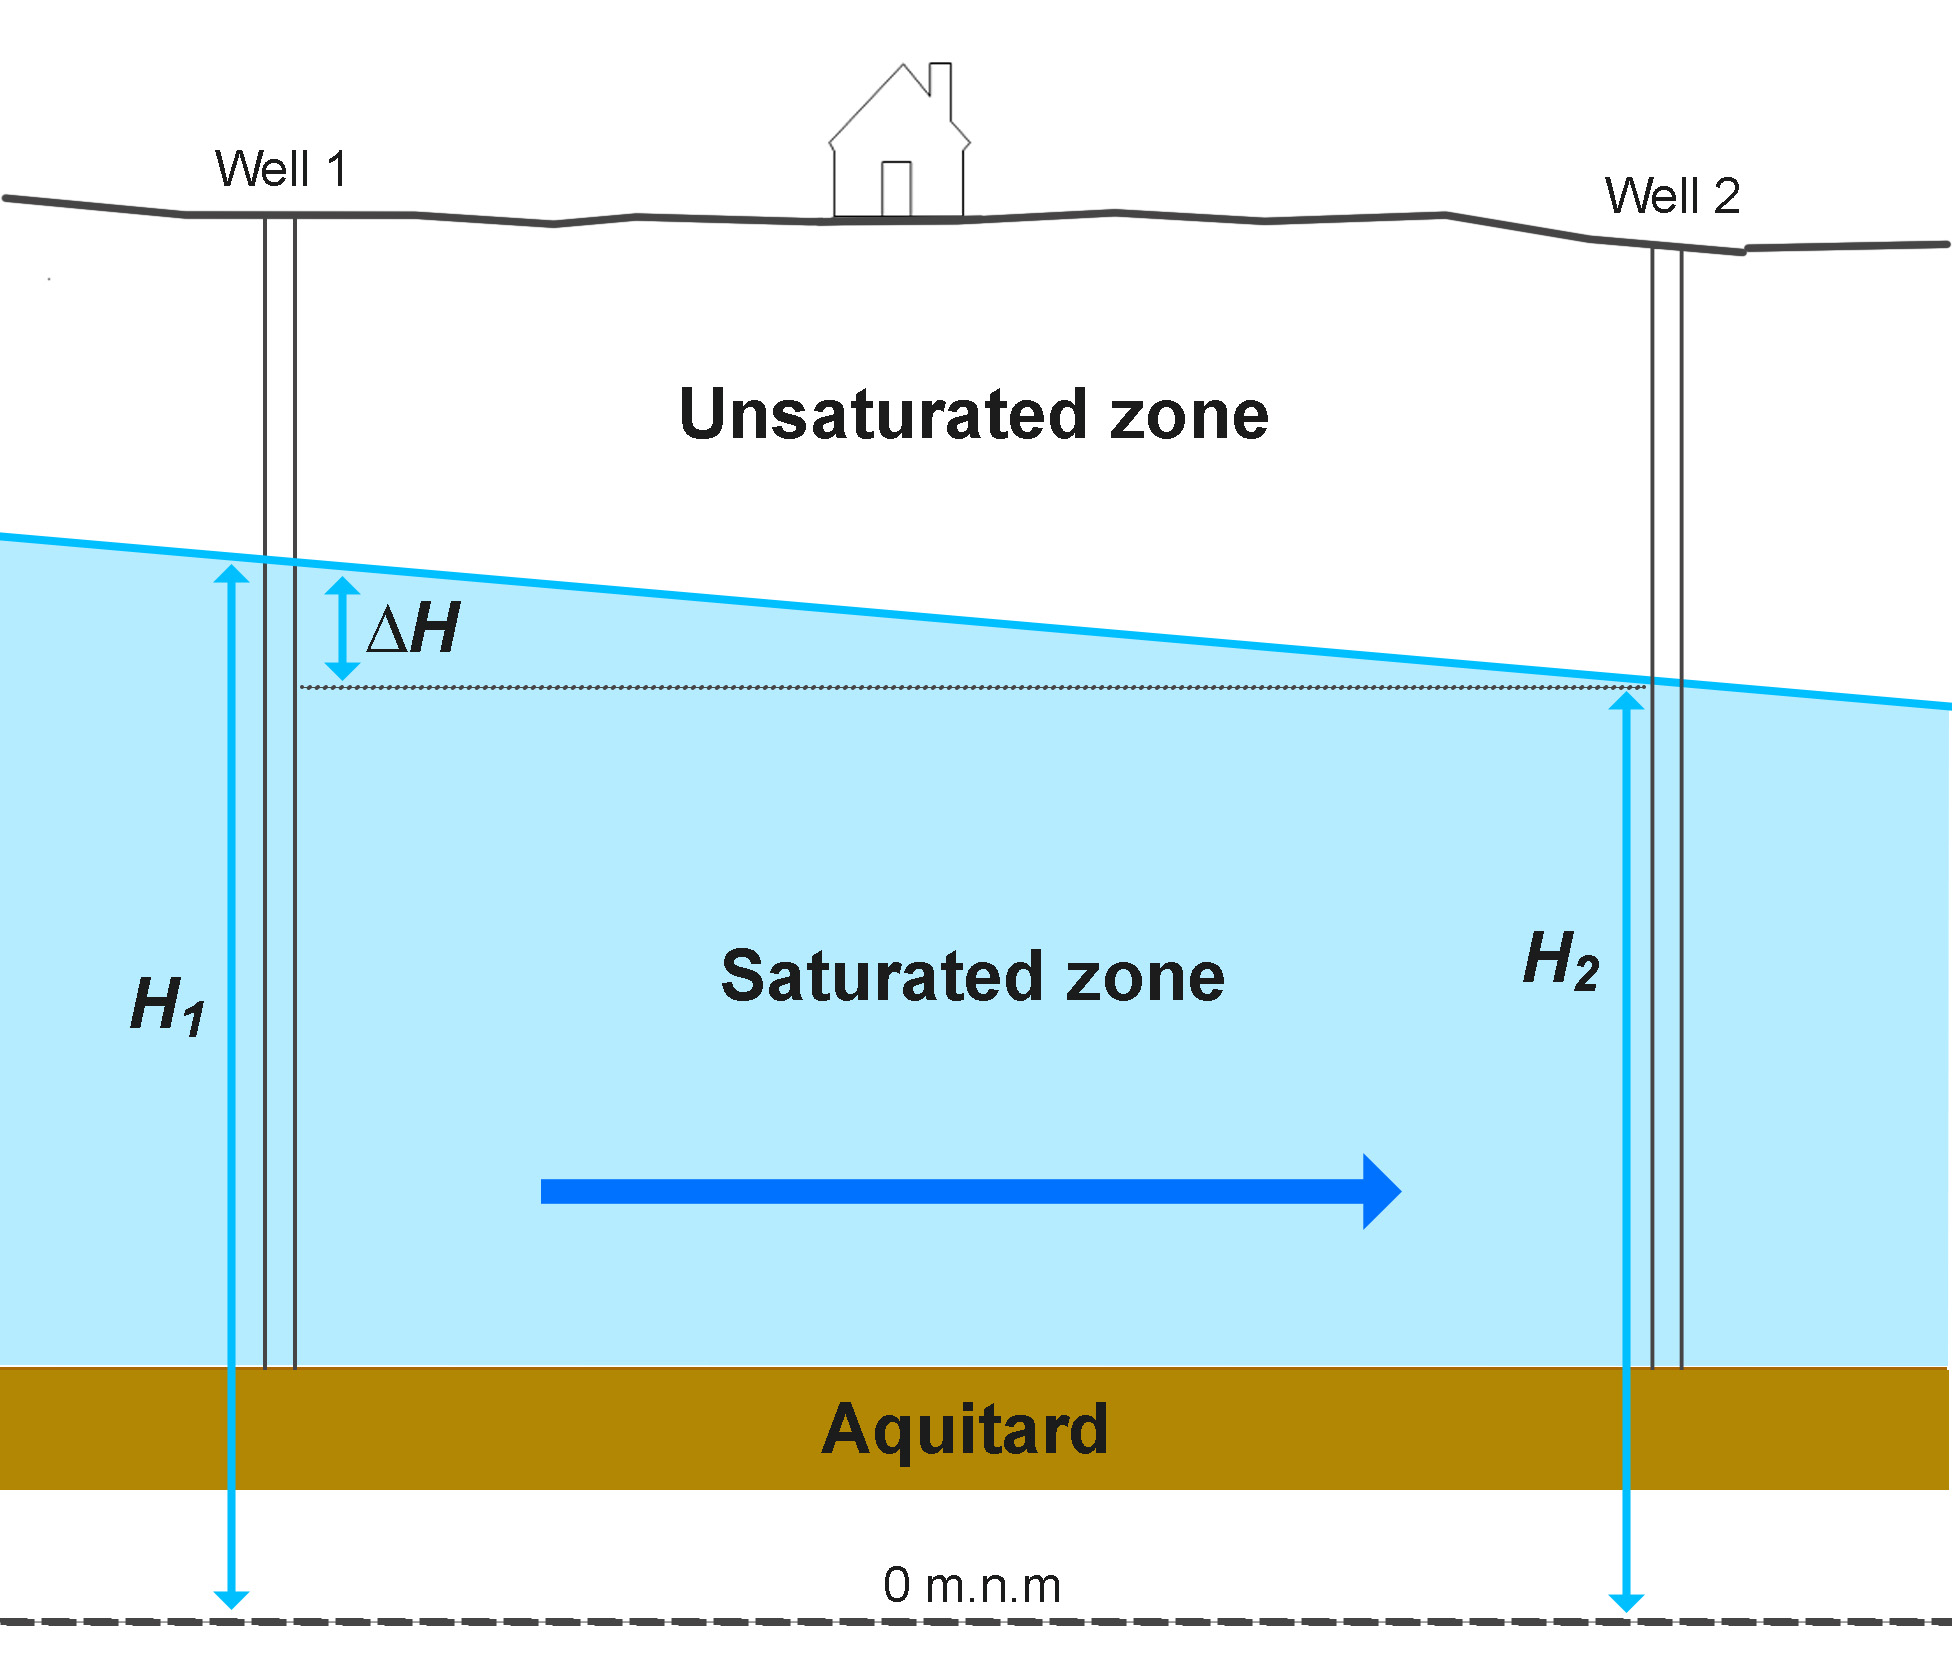
Across Alameda County, the estimated depth to the water table is around 322–339 ft (98–104 m), and drilling suitability is rated Low-potential location. Groundwater depth varies significantly from parcel to parcel – click your exact location on the map for a site-specific estimate.
These figures come from a digital hydrogeological model that combines terrain data, satellite-derived environmental datasets, hydrographic networks and geological information. They describe conditions at the geographic centre of the county (37.64714, -121.91249); conditions on your own parcel may differ significantly. This is an example – your parcel is what matters.
Open the map for Alameda County – free, unlimited depth estimate| Estimated depth to water table (range) | 322–339 ft (98–104 m) |
|---|---|
| At the exact centre point | 322 ft (98.2 m) |
| Recommended well depth | 453 ft (138.2 m) |
| Drilling suitability | Low-potential location |
| Estimated well yield | Low – about <3 GPM (<0.2 l/s) |
| Climate zone | drier (Mediterranean/continental) |
| Elevation at centre | 860 ft (262 m) |
| County land area | 1910 km² |
| Coordinates used | 37.64714, -121.91249 |
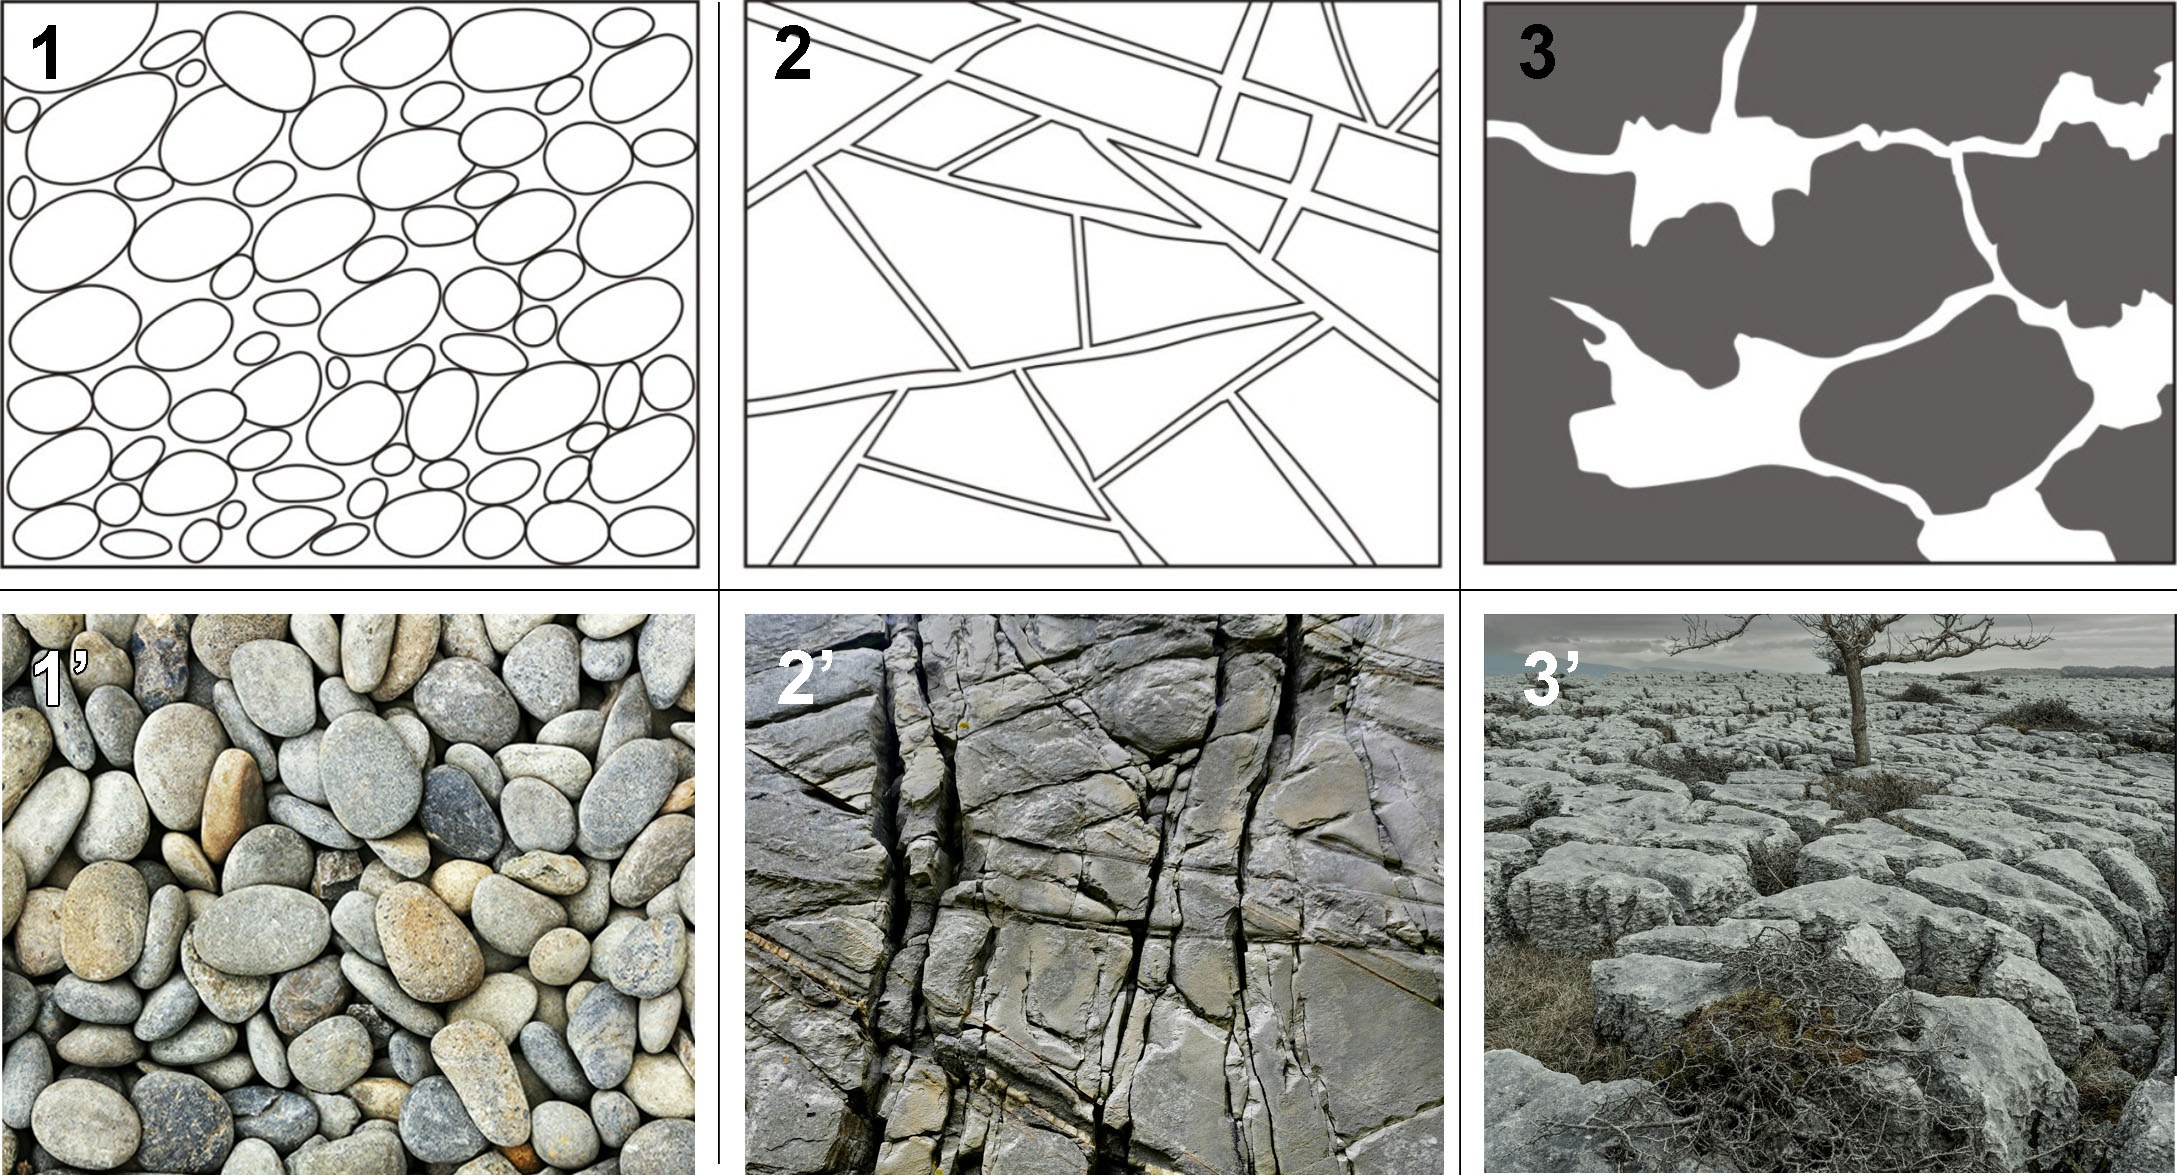
The expected well yield depends largely on the local geology, specifically on the type and characteristics of the rock within the saturated zone of the aquifer (the vertical zone below the groundwater table). Geological conditions can vary significantly from one location to another. As a result, wells located only a few dozen metres apart can have completely different yields. One well may produce enough water to supply an entire community, while another may be completely depleted within the first minute after a small pump is turned on.
In some cases, an aquifer may have an excellent water yield, but the groundwater table may be located at such a great depth that drilling the well and pumping water from that depth is not economically worthwhile.
Therefore, before drilling a well, it is important to estimate two key factors: the expected aquifer yield and the depth to the groundwater table. Together, these provide a preliminary assessment of the site’s suitability for well drilling and help you make an informed initial decision.
To make this assessment, you normally need access to several different types of maps and datasets, including geological, topographic, hydrographic and climate maps, as well as appropriate satellite imagery and other hydrogeological information about the area. All of these data must then be carefully analysed in accordance with the scientific principles of hydrogeology.
Today, obtaining this preliminary assessment is easier than ever before. Simply open the map, find your location, and click on the desired drilling point. The application will instantly provide an estimated groundwater depth, an estimated well yield, and an assessment of the site’s suitability for well drilling.
These results are calculated using a digital hydrogeological model, not AI. An AI tool is then used only to generate a clear and well-structured report in your selected language by summarising the model’s results. The AI also includes publicly available information about the selected location that may be useful to the user but does not influence the calculated results. In more complex cases, it can also help resolve uncertainties by analysing a photo of the site together with a short description provided by the user.
Contra Costa County · Santa Clara County · San Mateo County · Solano County · Santa Cruz County · San Joaquin County · Stanislaus County · Marin County
ReferencesRadulović M.M. (2026). Hidraulika podzemnih voda – izvod iz predavanja (Groundwater Hydraulics – Lecture Notes). University of Montenegro, Faculty of Civil Engineering, Podgorica. (Cites Freeze & Cherry, 1979; Heath, 1987.)Radulović Đ.M. (2003). Osnovi geologije (Fundamentals of Geology). University of Montenegro, Faculty of Civil Engineering, Podgorica, 234 p.
Data sources – Relief: produced using Copernicus WorldDEM-30 © DLR e.V. 2010-2014 and © Airbus Defence and Space GmbH 2014-2018 provided under COPERNICUS by the European Union and ESA; all rights reserved. Hydrography: HydroRIVERS / HydroLAKES (© WWF / HydroSHEDS). Lithology: GLiM (Hartmann & Moosdorf, 2012), CC BY 3.0. Climate: Köppen-Geiger (Beck et al., 2018).
Estimates generated by wheretodigwell.com on 2026-07-22. This is a preliminary, model-based assessment intended to support planning decisions before drilling. It is not a hydrogeological report and does not replace a site investigation by a licensed hydrogeologist or driller. Coordinates refer to the county’s geographic centroid. See the methodology & validation.